AI for Finance
Practical Applications of AI in Finance, Python and machine learning for FP&A
|
Every month, the same problem. A finance dataset lands in your inbox, multiple tabs, one per region, data starting halfway down the sheet, subtotals scattered between rows, some columns in quarters, others in halves or months. Before you can do any analysis, you spend hours cleaning it. This guide shows you three ways to eliminate that work using AI. Whether you need a quick one-time fix, a repeatable monthly process, or want to keep everything inside Excel — there is a method for you. 📁 All datasets, prompts, and templates referenced in this guide are available here: Data Cleaning with AI by Christian Martinez.xlsx And video guide here:
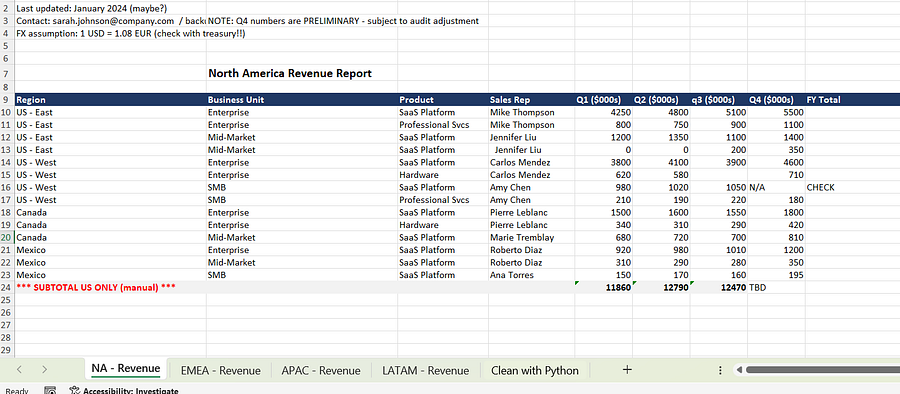
What We’re Working WithThe synthetic dataset used in this guide is intentionally messy — because that is what real finance files look like. Here is what makes it difficult: – Multiple tabs, one per region, with no consistent starting row – Data does not begin at cell A1 – Subtotals appear mid-table without warning – Some rows use quarterly data, others use halves or months – Totals missing the yearly figure altogether – Inconsistent formatting across regions
The goal: turn this into a clean, consolidated dataset — one starting row per region at A1 like this:
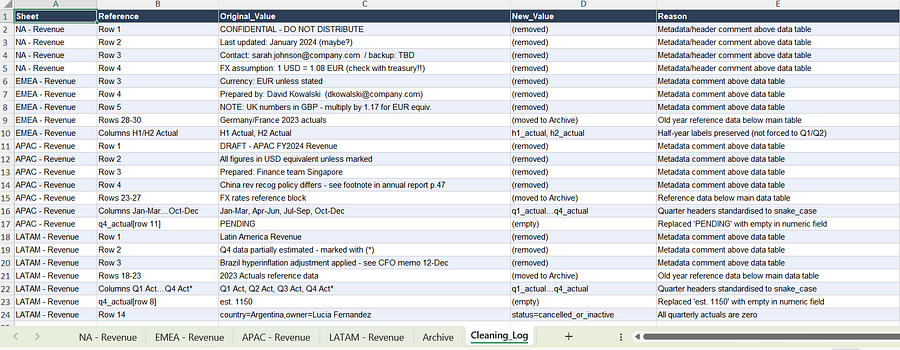
And it also has a cleaning log so you can audit exactly what changed.
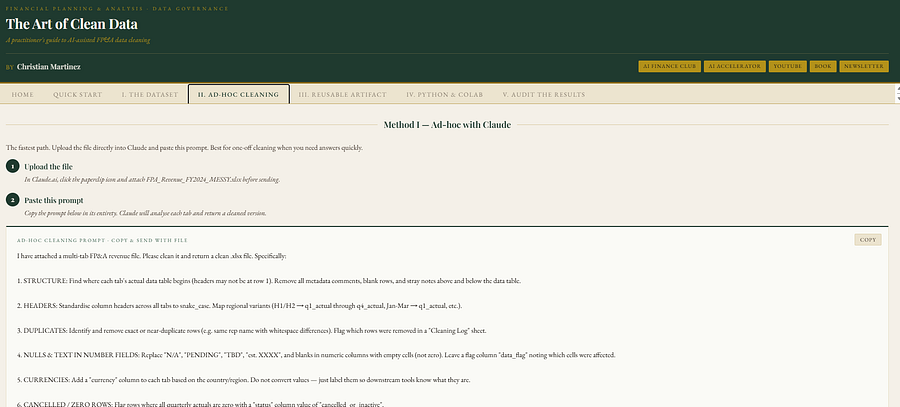
Method 1 : Data Cleaning with ClaudeBest for: one-time cleanups If this is an ad hoc exercise — something you only need to do once — the fastest path is to use Claude directly in the chat interface. How it works1. Open Claude at claude.ai 2. Use the + button to attach your Excel file 3. Paste in the prompt from the file below — then customise it for your dataset 4. Claude returns cleaned data and a cleaning log 5. Click download — file goes straight to your downloads folder The prompt provided works with the sample dataset. For your own file, you will need to describe your specific columns, inconsistencies, and what the clean output should look like. The prompt gives you the structure — adjust the details. https://claude.ai/public/artifacts/d92731ad-8069-4de9-b846-8ead914f1d46
When to use this– You have a one-off file that needs cleaning – You do not need to repeat the process next month – Speed matters more than reproducibility Method 2 Data Cleaning with Claude ArtifactsBest for: repeatable monthly processes If you need to clean the same type of file every month, building it once as a Claude Artifact makes far more sense. An Artifact is a mini-app Claude builds for you — one you can reuse, share with your team, and run on any new file without touching the prompt again. I have a decidated video on artifacts here: How to Create Claude Artifacts for Finance and FP&A How it works
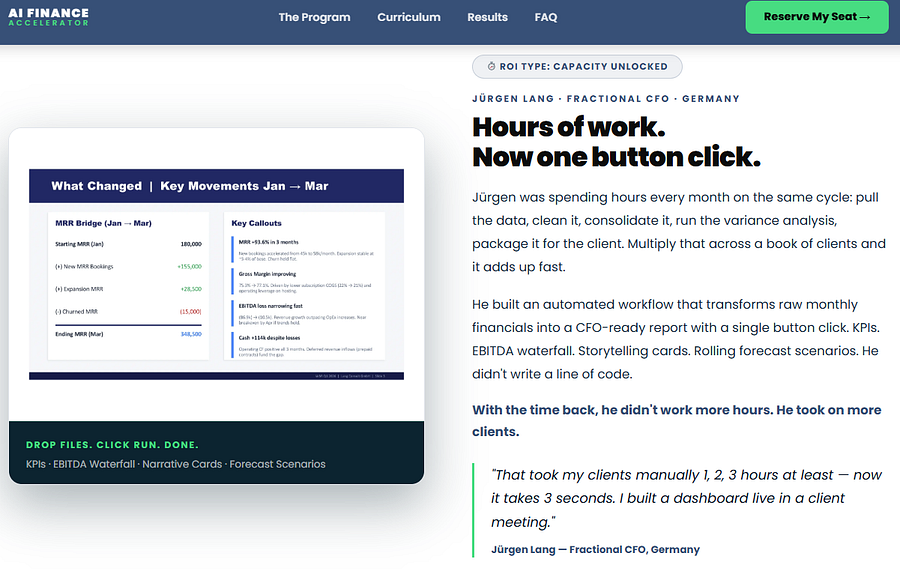
📁 Prompt template for Method 2: https://claude.ai/public/artifacts/d92731ad-8069-4de9-b846-8ead914f1d46 This is an example on how the app would look:
When to use this– Same file structure arrives every month – You want to share the cleaning process with your team – You want one place to run, audit, and repeat the cleaning Want more workflows like this?Join the AI Finance Club — a community for finance and accounting leaders building smarter workflows with AI. Templates, prompts, live sessions, and a network of peers doing the same work. Also explore our AI Finance Accelerator Program. In 6 weeks you’ll automate core reporting, turn numbers into board-ready narratives, and deploy a forecast pipeline you can defend to your CEO and board.
Method 3 Any AI + Python in Google ColabBest for: those who prefer to stay outside Claude If you would rather not use Claude — or if your organisation uses a different AI tool — this method works with any AI that can write Python code. You then run that code in Google Colab, which is free and requires no installation. How it works
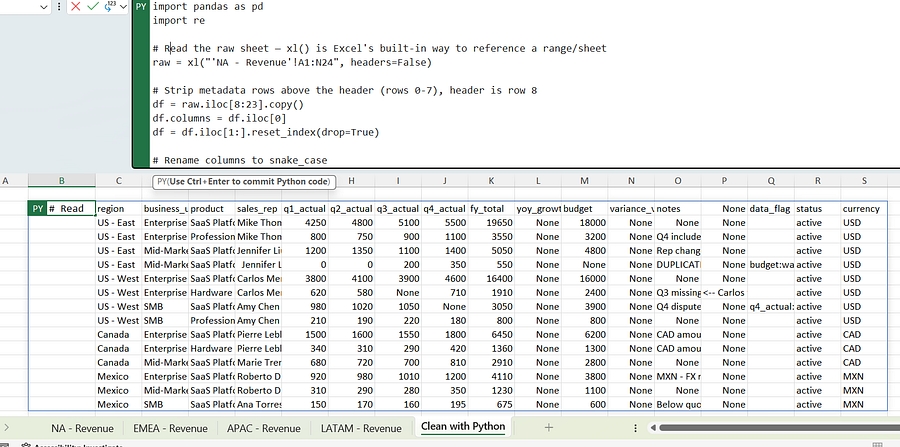
📁 Solution Colab notebook : https://colab.research.google.com/drive/1ip0-gJsay7IJb7KFcP2SNFzkI_wyJjlQ?usp=sharing Prompt: https://claude.ai/public/artifacts/d92731ad-8069-4de9-b846-8ead914f1d46 When to use this– Your organisation restricts access to Claude specifically – You are already comfortable with a different AI tool – You want full control over the Python logic Bonus: Run It Directly in Excel with =PYNo browser. If you have Python in Excel enabled, you can run the entire cleaning script directly inside your Excel file. You can learn more about Python in Excel including how to download here. How it works
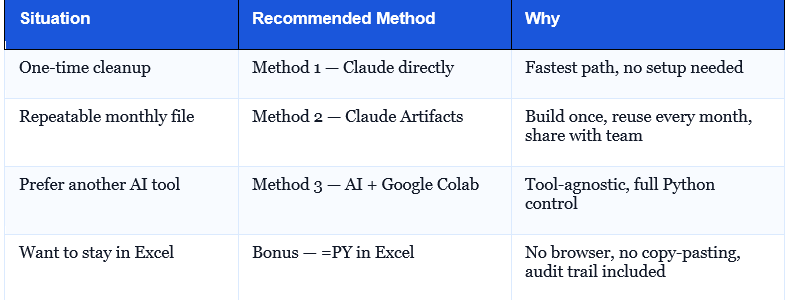
The script reads your raw sheet, strips metadata rows, standardises every column name, handles nulls and inconsistent values, recalculates FY totals, and flags anything ambiguous — with a full data_flag column so you have an audit trail. Which Method Should You Use?
Final ThoughtData cleaning is not analysis. Every hour spent reformatting rows is an hour not spent interpreting what the numbers mean. These three methods — and the bonus — give you options at every level of complexity and tool preference. Start with the one that fits your situation today. Build from there. Hope this helps! Christian Martinez |


AI for Finance
Practical Applications of AI in Finance, Python and machine learning for FP&A